
At a glance
Key findings
- Packages cluster tightly. Owner-reported 2026 package prices from mobile-turbine, recip-engine and mixed fleets sit at $930–1,200/kW. Fuel cells are about three times higher.
- Scope drives the price more than technology does. Equipment to package adds about 20%; package to balance of plant adds $300–550/kW; balance of plant to installed plant adds about $900/kW.
- Prices are still rising. Aero-derivative costs rose about 30% in 12 months, and power and distribution transformer prices are up 91% since January 2020.
- Time to power decides projects. Grid connections take 61–84 months and new heavy-duty turbines 36–72 months. Rental fleets and converted-aero packages deliver in 1–16 months.
- The transformer can erase a lead-time advantage. Electrical equipment from the generator to the campus bus is only about $90–110/kW, but a new step-up transformer takes 24–33 months.
- 800 V DC moves cost inside the data center. Analyst estimates put solid-state transformers at $1,000–1,500/kW and rack batteries at about $200/kW, replacing about $1,200/kW of central UPS. These are the weakest figures in the dataset.
What on-site generation costs
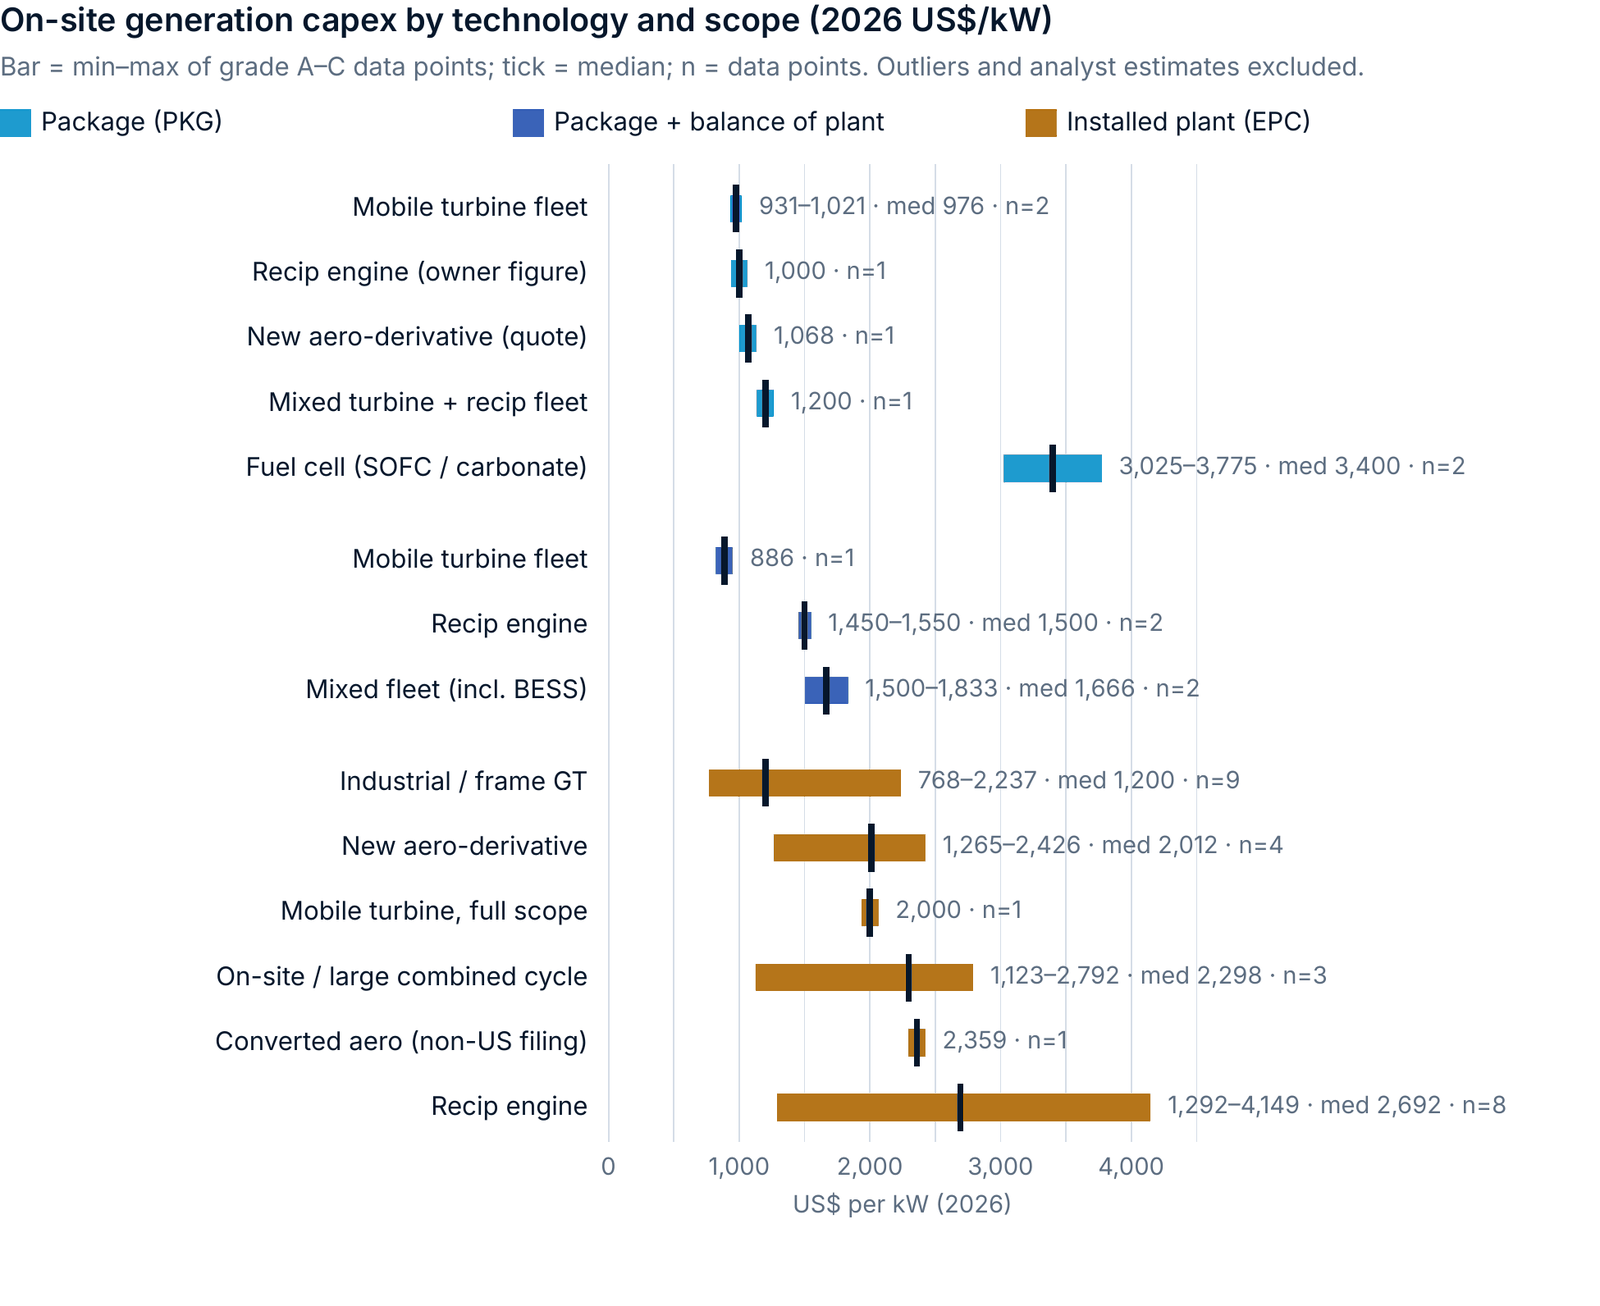
Large frame turbines look cheap per kW only at scale: the industrial and frame median of $1,200/kW installed is driven by 250–800 MW plants. Installed recip-engine plants vary most, from $1,292/kW to $4,149/kW. Only one public installed price exists for a refurbished aero-derivative package: about $2,360/kW in a Canadian utility filing.
How scope changes the price
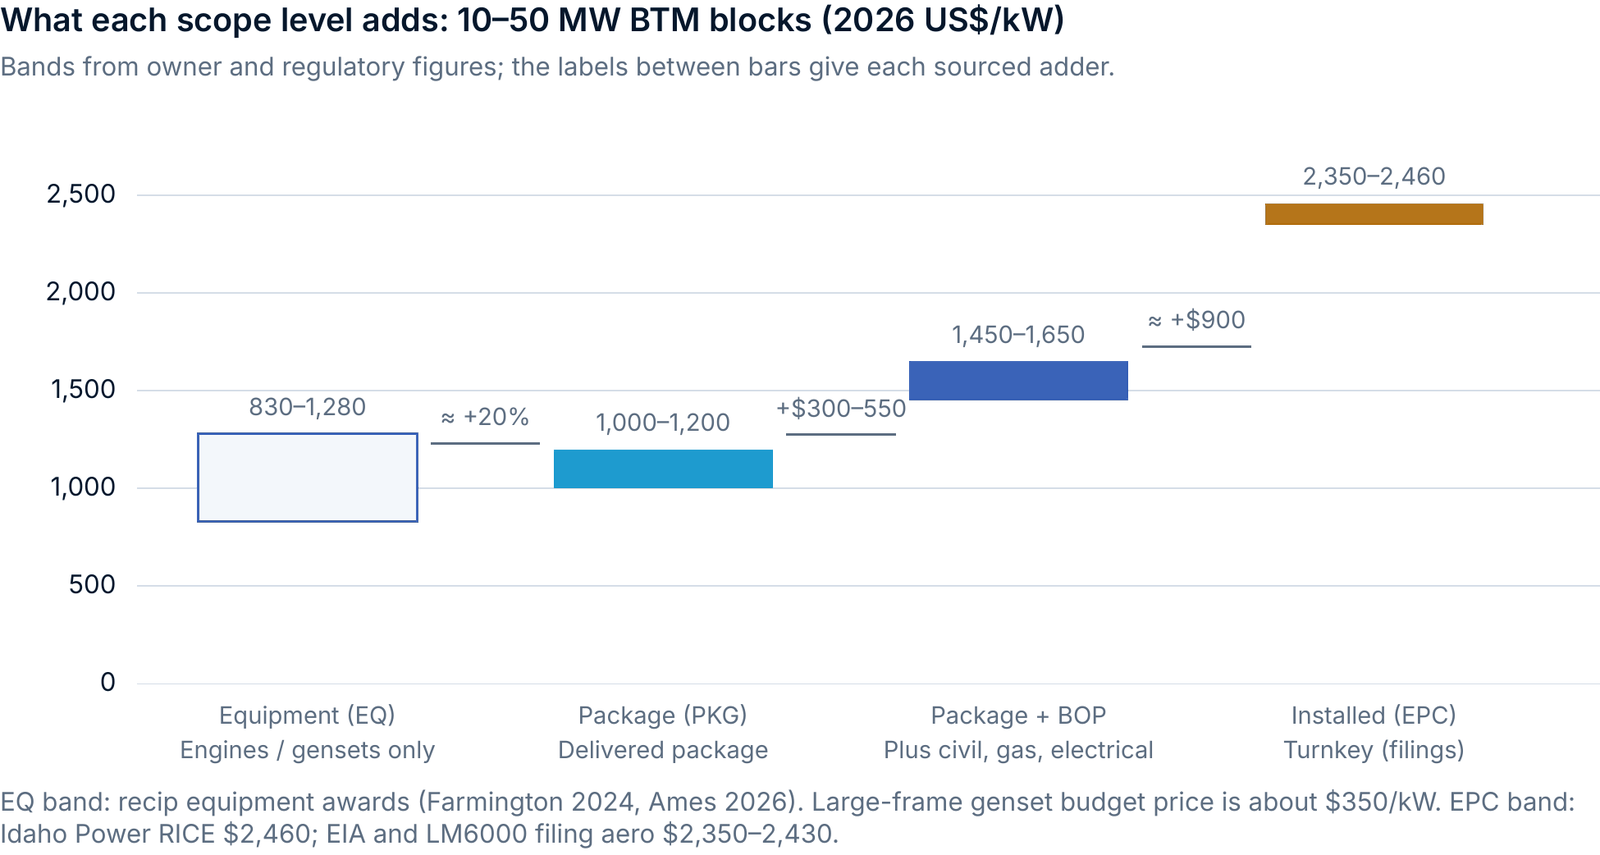
Before comparing two prices, put both at the same scope level. A $1,000/kW package and a $2,400/kW installed plant can describe the same equipment.
Time to power
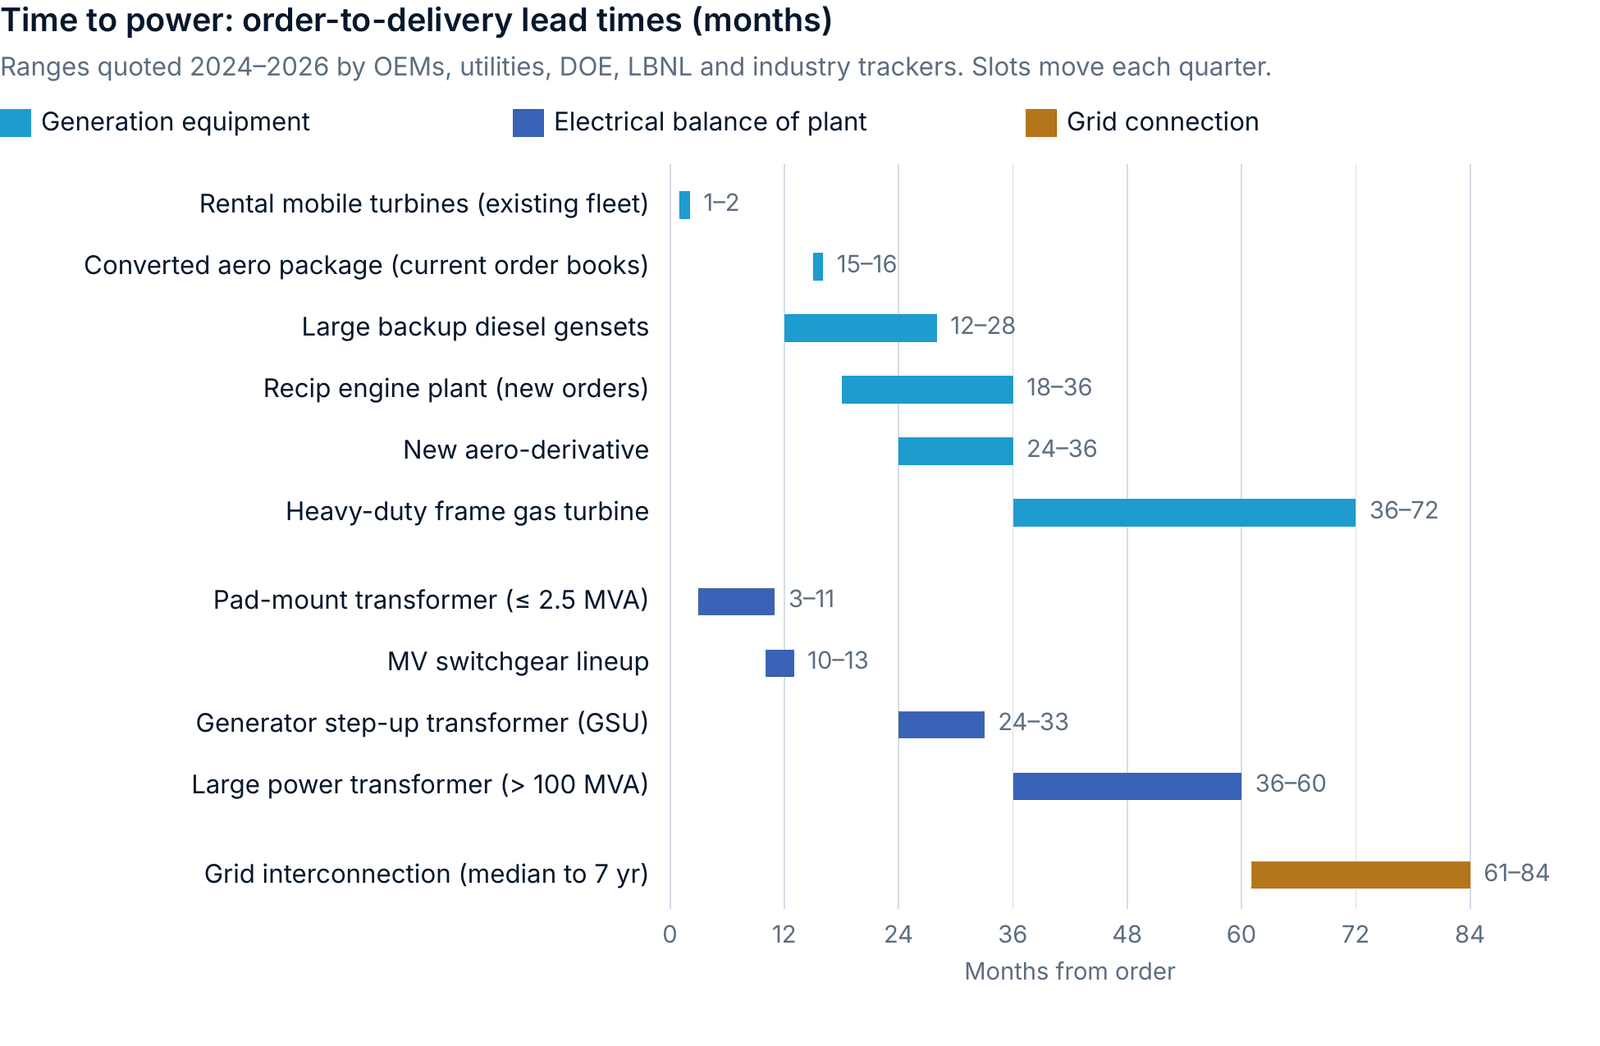
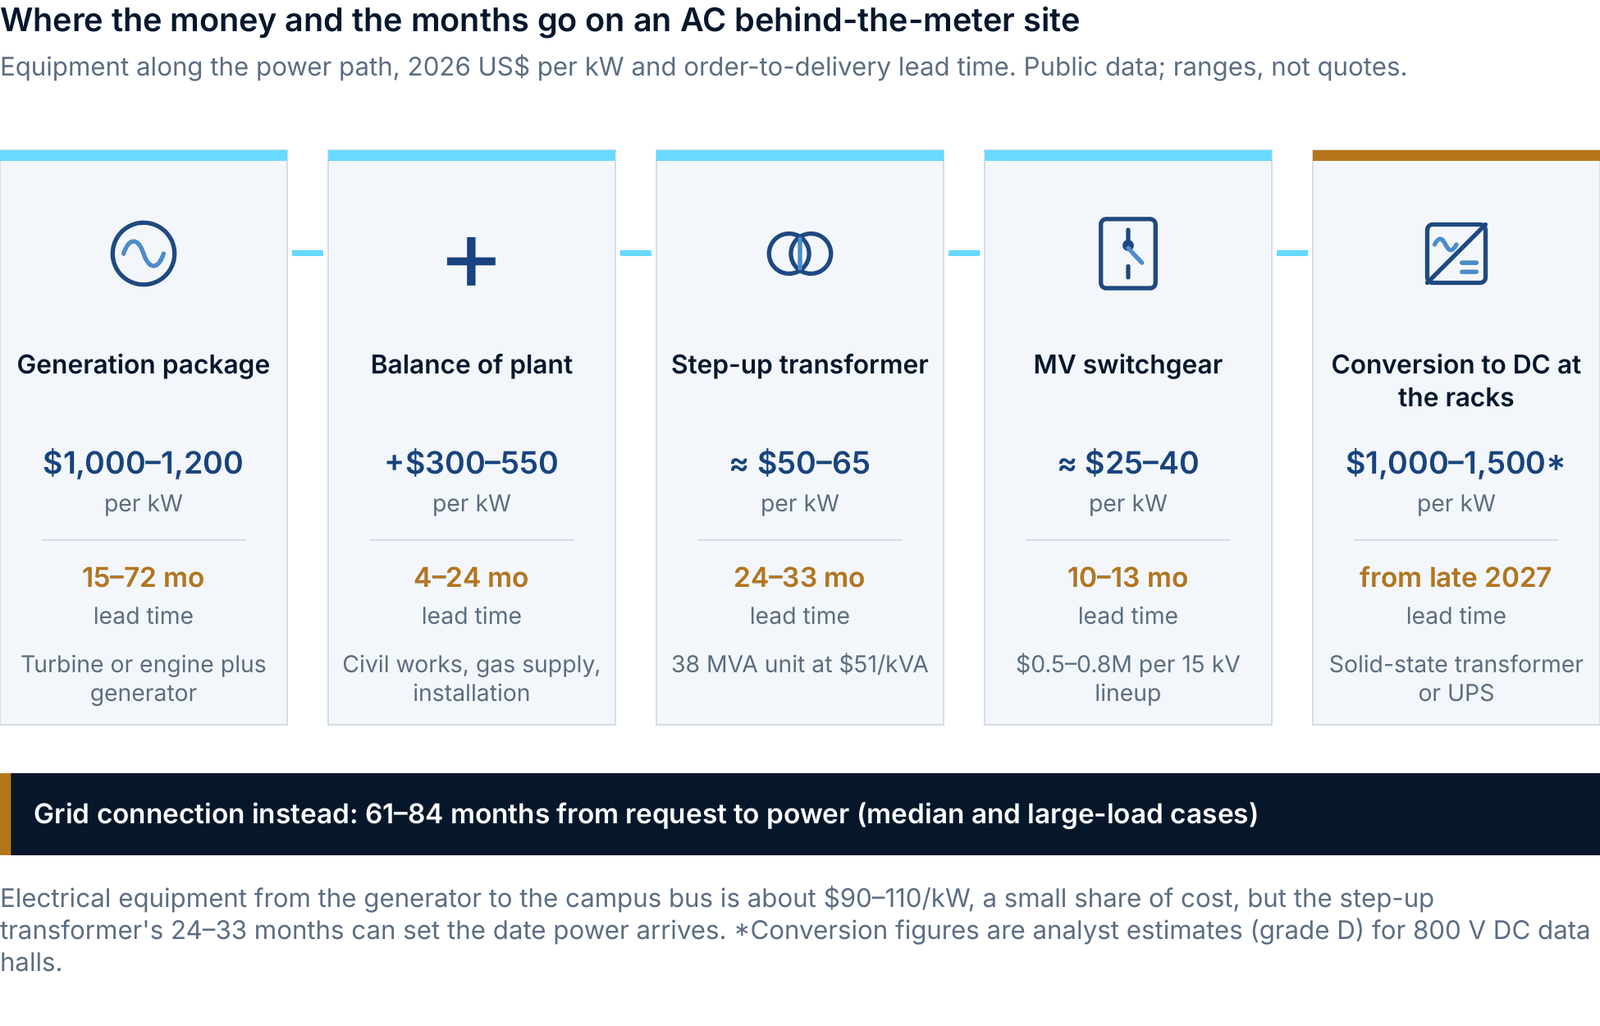
Developers keep a fast package’s lead-time advantage by connecting at generator voltage to the campus bus, ordering the step-up transformer with the package, or using refurbished or stocked units.
Price trend
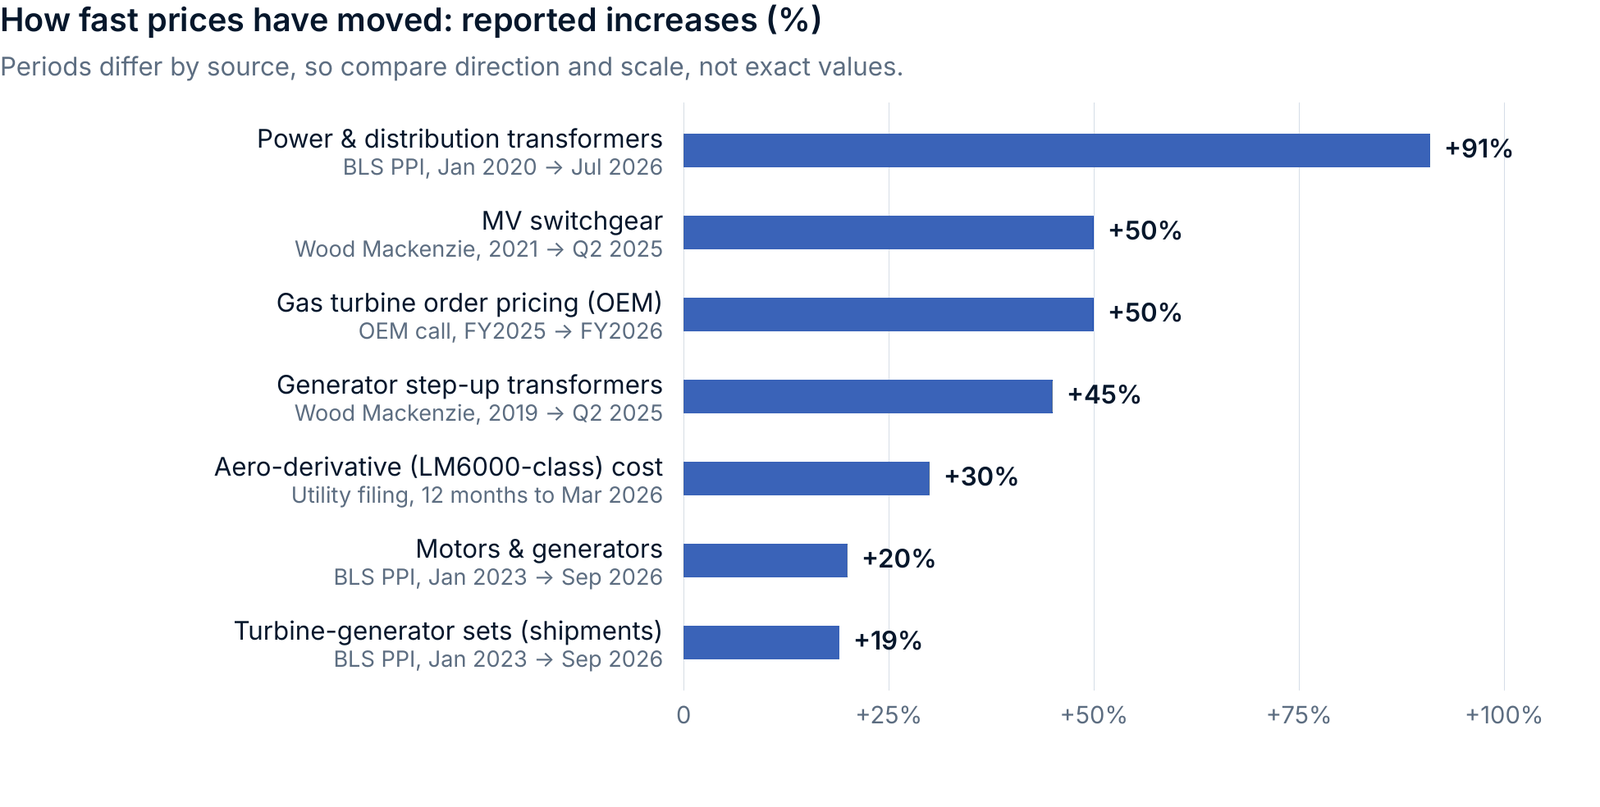
Order prices lead shipment prices. The producer price index for turbine-generator sets is up only about 19% since January 2023, because it records equipment shipped against older orders.
Demand risk: what could change in 12 months
These prices and lead times describe a market where demand runs ahead of supply. That can change faster than equipment prices do, because much of the headline demand is counted more than once: the same campus can sit in several utility queues, a developer’s pipeline, a packager’s backlog and an EPC contractor’s bid list before a rack is ordered.
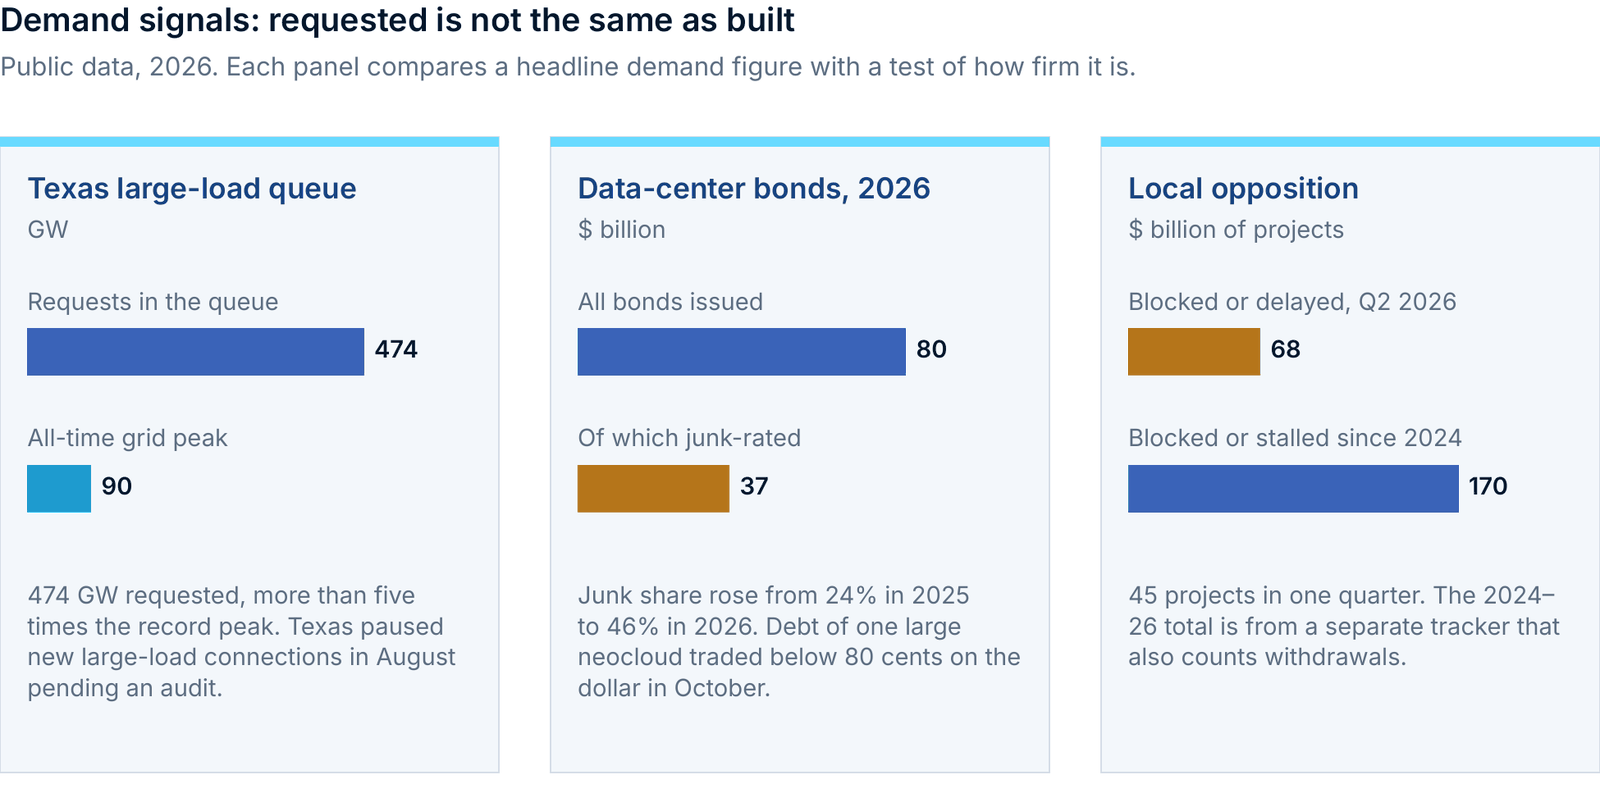
- Demand counted more than once. Texas has more than 474 GW of large-load requests against a record peak of about 90 GW, and paused new large-load connections in August pending an audit. Utility forecasts filed with FERC run about 40% above credible industry projections.
- Financing strain. About $37 billion of the $80 billion of data-center bonds issued in 2026 is junk-rated, against $8.6 billion of $36 billion in 2025.
- Spending plateau. Alphabet held its 2026 capex guidance unchanged in October while signaling an increase in 2027; Microsoft kept its 2026 plan unchanged.
- Slipping schedules and local opposition. About half of the capacity scheduled for 2026 may slip, and 45 projects worth $68 billion were blocked or delayed in the second quarter of 2026.
- Order books include options. One large equipment maker reported 56 GW of slot reservations on top of 44 GW of backlog, and a 1.21 GW turbine order was cancelled in September.
- Policy. The November 2026 midterm elections may change federal energy, trade and permitting policy, in either direction.
What it would mean: lead times shorten first and prices follow more slowly, small-unit package prices drift back toward the 2025 level of $900–950/kW, and the premium for speed narrows except where the grid connection itself is the constraint. Buyers should keep commitments short, prefer equipment that can be relocated or resold, and ask for cancellation terms with the price.
Before you compare quotes
- Check what each price covers: equipment only, a delivered package, package plus balance of plant, or an installed plant.
- Ask whether a price is a firm order, a budget estimate or a completed purchase. One headline turbine order in our data was later cancelled.
- Ask for the delivery month, not just the price, and include the step-up transformer and switchgear in the schedule.
- Check whether the price includes emissions control, black start and medium-voltage switchgear.
- Don’t update an older price with inflation indices alone. They track shipments, which lag new orders by one to three years.
- Treat 800 V DC, solid-state transformer and rack-battery prices as indicative until the first orders are public.
How the data was built
| Grade | Meaning |
|---|---|
| A | Primary transaction, award or filing with a stated price |
| B | Regulatory estimate or reliable secondary report of a transaction |
| C | Derived from aggregates, or a quote that was not completed |
| D | Analyst estimate, vendor claim or modeled figure; context only |
Every data point has a URL, the source date and a quote or table reference. Prices are escalated to 2026 US$ with the relevant producer price index. No equipment maker publishes an absolute $/kW for turbine packages, so the package band is inferred from owner fleet figures disclosed on earnings calls and in SEC filings.
Read the full paper
Fifteen pages: the data by technology and scope, demand risks for the next 12 months, transformers and switchgear, 800 V DC equipment, delivered energy cost, a buyer’s checklist and the main sources.
Download the white paper (PDF)Sources
- Utility and municipal awards and bid tabulations: Tacoma Public Utilities, Eugene Water & Electric Board, Omaha Public Power District, Fayetteville PWC, Greenville Utilities Commission, City of Ames, City of Farmington and others.
- Regulatory filings and resource plans: Maritime Electric (PEI IRAC), Idaho Power, Montana-Dakota, East Kentucky Power Cooperative, Northwest Power & Conservation Council, PJM TEAC, Texas Energy Fund.
- Government data: US EIA AEO2026 assumptions; US DOE Large Power Transformer Resilience Report; NREL; LBNL Queued Up 2026; CRS R48933; BLS producer price indices via FRED.
- Company disclosures: SEC filings and earnings calls of on-site power owners and equipment makers, 2025–2026.
- Demand risk: Utility Dive (speculative load, Texas SB 6, citing Grid Strategies and Goldman Sachs); Forbes (data-center bonds, citing Barclays, October 16, 2026); Bloomberg (Data Center Watch, September 21, 2026); Axios (Sightline Climate, February 24, 2026); CNBC (Alphabet and Microsoft capex, October 28–29, 2026).
- Industry and analyst sources: Gas Turbine World, Wood Mackenzie (via POWER), Lazard LCOE+, RaboResearch, Modo Energy, Cushman & Wakefield, SemiAnalysis.
Read with care: figures are public market data, not Hyper Tech estimates, quotes or offers. Analyst estimates are labeled as such. Prices moved 30–50% in the past 12 months; check before relying on any figure. Company names belong to their owners; Hyper Tech is not affiliated with them.
More: CROSSOVER, power for AI data centers · News · Resources